Data-Informed Thinking + Doing
Numerical Predictions Using Ridge and Lasso Regression
—using scikit-learn for Python.
Getting Started
Before diving in, the process/pipeline will be the following:
[Flow chart here]
If you are interested in reproducing this work, here are the versions of Python and Python packages used:
import sys
print(sys.version)
## 3.9.1 (v3.9.1:1e5d33e9b9, Dec 7 2020, 12:10:52)
## [Clang 6.0 (clang-600.0.57)]# !pip install "numpy==1.20.0"
# !pip install "pandas==1.2.2"
# !pip install "matplotlib==3.3.4"
# !pip install "seaborn==0.11.1"
# !pip install "scikit-learn==0.24.1"
import numpy as np
import pandas as pd
import matplotlib.pyplot as plt
import seaborn as sns
from sklearn import datasets
from sklearn import linear_modelsns.set()
plt.style.use("ggplot")
iris = datasets.load_iris()
type(iris)## <class 'sklearn.utils.Bunch'>print(iris.keys())## dict_keys(['data', 'target', 'frame', 'target_names', 'DESCR', 'feature_names', 'filename'])type(iris.data), type(iris.target)## (<class 'numpy.ndarray'>, <class 'numpy.ndarray'>)iris.data.shape## (150, 4)iris.target_names## array(['setosa', 'versicolor', 'virginica'], dtype='<U10')x = iris.data
y = iris.target
df = pd.DataFrame(x, columns=iris.feature_names)
print(df.head())## sepal length (cm) sepal width (cm) petal length (cm) petal width (cm)
## 0 5.1 3.5 1.4 0.2
## 1 4.9 3.0 1.4 0.2
## 2 4.7 3.2 1.3 0.2
## 3 4.6 3.1 1.5 0.2
## 4 5.0 3.6 1.4 0.2_ = pd.plotting.scatter_matrix(df, c = y, figsize = [8, 8], s = 150, marker = "D")
plt.show()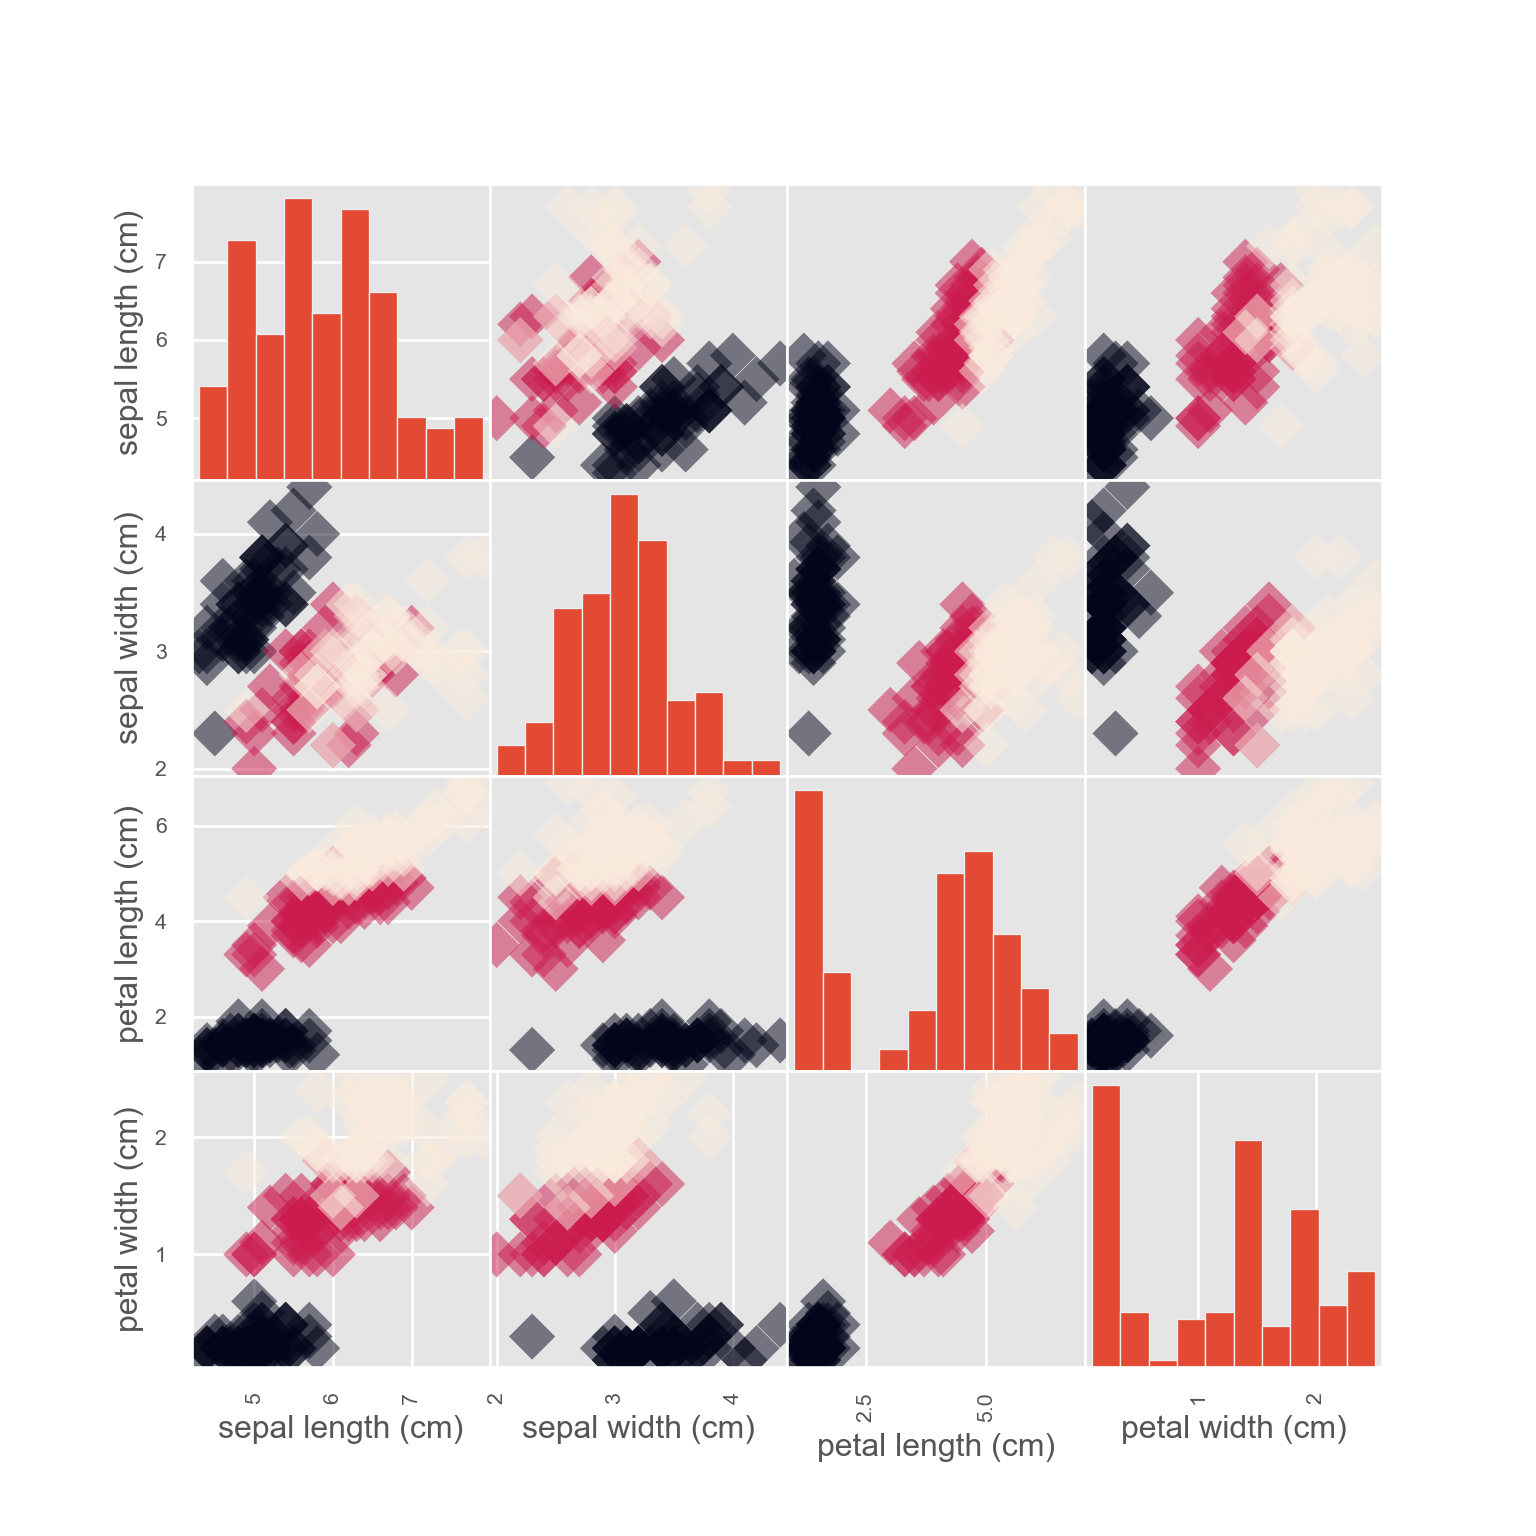
Applied Advanced Analytics & AI in Sports